
- 분류 전체보기 (7878)

- 공지사항 (22)
- Format&Encrypt (13)
- Java (360)
- C (50)
- C++ (52)
- C샵 (NET) (143)
- Python (150)
- Go Lang (Go 언어) (107)
- Kotlin (549)
- Swift (219)
- Objective-C (193)
- Android (970)
- IOS (638)
- Flutter (364)
- FrontEnd (109)
- JavaScript (382)
- Jquery (103)
- Http & Api (101)
- VueJs (51)
- AngularJs (10)
- ReactJs (16)
- SE & OS & HW (52)
- DataBase (103)
- OracleDB (202)
- MySqlDB (103)
- MsSqlDB (107)
- Network (113)
- Spring (118)
- NodeJs (222)
- Redis (RDS) (31)
- Aws (Amazon) (43)
- ADB (cmd) (47)
- MacOs (cmd) (27)
- Linux (cmd) (146)
- Window (cmd) (34)
- Office (23)
- 비트버킷 & Git (75)
- Library & F.W (111)
- 참고 사이트 (159)
- IT정보 & IT소식 (260)
- IT기술 & IT용어 (267)
- 투케이2K 에러관리 (302)
- 투케이2K 업무정리 (148)
- 투케이2K 유틸파일 (162)
- 투케이2K 알고리즘 (105)
- 투케이2K 로직정리 (137)
- 투케이2K 학습정리 (140)
- 투케이2K 일상&생활 (39)
Notice
Recent Posts
Recent Comments
Link
투케이2K
103. (javascript/자바스크립트) bar chart 반응형 및 커스텀 차트 작업 실시 - chart js 라이브러리 사용 본문
JavaScript
103. (javascript/자바스크립트) bar chart 반응형 및 커스텀 차트 작업 실시 - chart js 라이브러리 사용
투케이2K 2021. 7. 27. 17:41[개발 환경 설정]
개발 툴 : Edit++
개발 언어 : javascript

[소스 코드]
<!DOCTYPE HTML>
<!-- 자바스크립트 차단된 콘텐츠 자동 허용 실시 -->
<!-- saved from url=(0013)about:internet -->
<!-- 표시 언어 지정 -->
<html lang="ko">
<!-- 헤더 정의 부분 -->
<head>
<title>HTML TEST</title>
<meta http-equiv="Content-Type" content="text/html; charset=utf-8">
<meta http-equiv="X-UA-Compatible" content="IE=edge">
<!-- 내부 CSS 스타일 지정 -->
<style>
/* html, body 영역 스타일 지정 */
html, body{
width : 100%;
height : 100%;
margin : 0;
padding : 0;
border : none;
overflow : auto;
}
/* [body 스크롤바 메인 스타일 지정] */
body::-webkit-scrollbar {
width: 10px;
background-color: #c1c1c1;
}
/* [body 스크롤바 thumb 스타일 지정] */
body::-webkit-scrollbar-thumb {
background-color: #444444;
}
/* [캔버스 부모 div 레이아웃] */
#canvas_container{
width: 70%;
height: 50%;
margin: 0 auto;
padding: 0;
border: 1px solid #000000;
border-radius: 20px;
background-color: #ffffff;
position: relative;
top: 5%;
left: 0;
display: block;
}
</style>
<!-- Jquery CDN 로드 : 항상 최신 버전 사용 -->
<script src="https://code.jquery.com/jquery-latest.min.js"></script>
<!-- chart js 라이브러리 -->
<script src="https://cdnjs.cloudflare.com/ajax/libs/Chart.js/3.5.0/chart.min.js"></script>
<!-- 내부 JS 지정 -->
<script>
/*
[JS 요약 설명]
1. window.onload : 브라우저 로드 완료 상태를 나타냅니다
2. window.getComputedStyle : 특정 객체 스타일 속성 값을 확인합니다
3. chart js : <canvas> 사용해 차트를 렌더링 하며 단일 노드와 함께 페이지에 포함된 스크립트만 있으면 됩니다
4. myChart.destroy() : 생성된 차트를 삭제합니다
5. chart js 공식 사이트 : https://www.chartjs.org/docs/latest/
6. chart js cdn 참고 사이트 : https://cdnjs.com/libraries/Chart.js
*/
/* [html 최초 로드 및 이벤트 상시 대기 실시] */
window.onload = function() {
console.log("");
console.log("[window onload] : [start]");
console.log("");
/* [캔버스 크기 지정 함수 호출] */
canvasSizeCheck();
/* [bar 세로 막대 : 그리기 실시] */
drawBarHeight();
};
/* [html 화면 사이즈 변경 이벤트 감지] */
window.onresize = function() {
console.log("");
console.log("[window onresize] : [start]");
console.log("");
/* [캔버스 크기 지정 함수 호출] */
canvasSizeCheck();
/* [bar 세로 막대 : 그리기 실시] */
drawBarHeight();
};
/* [차트 그리기에 사용할 전역 변수 지정 실시] */
var canvas;
var ctx;
var height = "";
var width = "";
var myChart;
/* [캔버스 크기 지정 실시] */
function canvasSizeCheck(){
console.log("");
console.log("[canvasSizeCheck] : [start]");
console.log("");
// [캔버스를 포함하고 있는 상위 부모 컨테이너 id 지정 >> 부모 컨테이너 크기에 맞춰서 캔버스 리사이즈]
var tagId = document.getElementById("canvas_container");
height = window.getComputedStyle(tagId).height;
width = window.getComputedStyle(tagId).width;
console.log("");
console.log("[canvasSizeCheck] : [height] : " + height);
console.log("[canvasSizeCheck] : [width] : " + width);
console.log("");
// [화면 사이즈가 변경된 경우 기존 차트 삭제 실시]
if(ctx != null){
canvas.getContext("2d").clearRect(0, 0, canvas.width, canvas.height);
ctx.beginPath();
myChart.destroy();
}
};
/* [bar 세로 막대 : 그리기 함수] */
function drawBarHeight(){
console.log("");
console.log("[drawBarHeight] : [start]");
console.log("");
// [body 에 선언된 캔버스 id 지정 실시]
canvas = document.getElementById('myBarHeightChart');
ctx = canvas.getContext('2d');
// [캔버스 크기를 부모 컨테이너 크기에 맞춥니다 : 부모 크기 % 지정 (반응형)]
canvas.height = height;
canvas.width = width;
// [차트 그리기 실시]
myChart = new Chart(ctx, {
type: 'bar', // [차트 타입 지정]
data: {
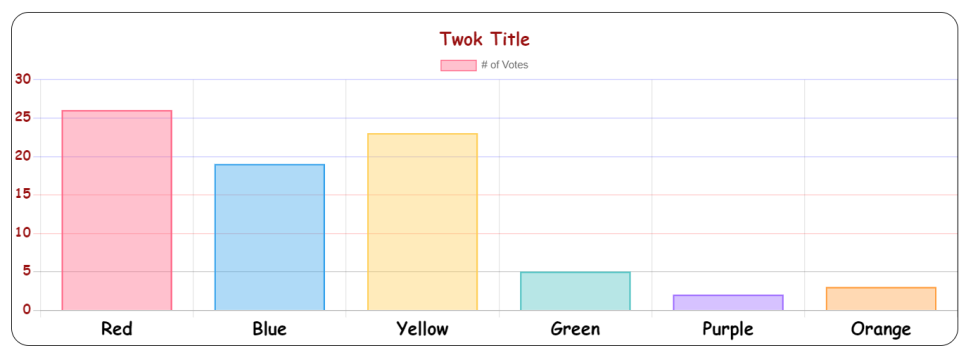
labels: ['Red', 'Blue', 'Yellow', 'Green', 'Purple', 'Orange'], // [데이터 라벨 (제목)]
datasets: [{
label: '# of Votes', // [데이터 시트 제목]
data: [26, 19, 23, 5, 2, 3], // [데이터 : Red ~ Orange]
backgroundColor: [ // [막대 배경 색상 : Red ~ Orange ]
'rgba(255, 99, 132, 0.4)',
'rgba(54, 162, 235, 0.4)',
'rgba(255, 206, 86, 0.4)',
'rgba(75, 192, 192, 0.4)',
'rgba(153, 102, 255, 0.4)',
'rgba(255, 159, 64, 0.4)'
],
borderColor: [ // [막대 테두리 색상 : Red ~ Orange ]
'rgba(255, 99, 132, 1)',
'rgba(54, 162, 235, 1)',
'rgba(255, 206, 86, 1)',
'rgba(75, 192, 192, 1)',
'rgba(153, 102, 255, 1)',
'rgba(255, 159, 64, 1)'
],
borderWidth: 1 // [막대 테두리 굵기 설정]
}]
},
options: {
plugins: {
title: { // [차트 타이틀 지정 실시]
display: true,
text: 'Twok Title',
color: '#911', // [타이틀 폰트 색상]
font: { // [타이틀 폰트 스타일 변경]
family: 'Comic Sans MS',
size: 20,
weight: 'bold',
lineHeight: 1.2,
},
padding: {top: 20, left: 0, right: 0, bottom: 0}
}
},
scales: {
y: { // [y 축 관련 설정]
min: 0, // [y 축 데이터 설정 0 ~ 30 까지 제한]
max: 30,
grid: { // [y 축 데이터 시트 배경 선색 표시]
drawBorder: false,
color: function(context) {
if (context.tick.value >= 20) {
return 'rgba(0, 0, 255, 0.2)'; // 파랑
}
else if (context.tick.value < 20 && context.tick.value >= 10) {
return 'rgba(255, 0, 0, 0.2)'; // 빨강
}
else {
return 'rgba(0, 0, 0, 0.2)'; // 검정색
}
}
},
ticks: {
color: '#911', // [y 축 폰트 색상 설정]
font: { // [y축 폰트 스타일 변경]
family: 'Comic Sans MS',
size: 15,
weight: 'bold',
lineHeight: 1.2,
}
}
},
x: { // [x 축 관련 설정]
ticks: {
color: '#000000', // [x 축 폰트 색상 설정]
font: { // [x축 폰트 스타일 변경]
family: 'Comic Sans MS',
size: 20,
weight: 'bold',
lineHeight: 1.2,
}
}
}
}
}
});
};
</script>
</head>
<body>
<!-- 레이아웃 : bar 세로 막대 -->
<div id="canvas_container">
<canvas id="myBarHeightChart"></canvas>
</div>
</body>
</html>
[결과 출력]
[요약 설명]
/*
[JS 요약 설명]
1. window.onload : 브라우저 로드 완료 상태를 나타냅니다
2. window.getComputedStyle : 특정 객체 스타일 속성 값을 확인합니다
3. chart js : <canvas> 사용해 차트를 렌더링 하며 단일 노드와 함께 페이지에 포함된 스크립트만 있으면 됩니다
4. myChart.destroy() : 생성된 차트를 삭제합니다
5. chart js 공식 사이트 : https://www.chartjs.org/docs/latest/
6. chart js cdn 참고 사이트 : https://cdnjs.com/libraries/Chart.js
*/
[파일 첨부]
반응형
'JavaScript' 카테고리의 다른 글
'JavaScript' Related Articles
more


Comments